
The information contained in the following Marketing Brochure is proprietary and strictly confidential. It is intended to be reviewed only by the party receiving it from Marcus & Millichap and should not be made available to any other person or entity without the written consent of Marcus & Millichap. This Marketing Brochure has been prepared to provide summary, unverified information to prospective purchasers, and to establish only a preliminary level of interest in the subject property. The information contained herein is not a substitute for a thorough due diligence investigation. Marcus & Millichap has not made any investigation, and makes no warranty or representation, with respect to the income or expenses for the subject property, the future projected financial performance of the property, the size and square footage of the property and improvements, the presence or absence of contaminating substances, PCB's or asbestos, the compliance with State and Federal regulations, the physical condition of the improvements thereon, or the financial condition or business prospects of any tenant, or any tenant’s plans or intentions to continue its occupancy of the subject property. The information contained in this Marketing Brochure has been obtained from sources we believe to be reliable; however, Marcus & Millichap has not verified, and will not verify, any of the information contained herein, nor has Marcus & Millichap conducted any investigation regarding these matters and makes no warranty or representation whatsoever regarding the accuracy or completeness of the information provided. All potential buyers must take appropriate measures to verify all of the information set forth herein.
Property Tours: All tours are by appointment only. To schedule a tour please contact:
Lisa Ritter I Marcus & Millichap National Tax Credit Property Advisors 206.826.5700 I lritter@marcusmillichap.com
Listing Agent Contact: For additional details about the investment opportunity, please contact the primary listing agents:
Armand W. Tiberio
Robert L. Sheppard I Spencer H. Hurst I Jeff Kunitz
Marcus & Millichap National Tax Credit Property Advisors
1420 Fifth Avenue, Suite 1600 I Seattle, WA 98101
206.826.5700 phone I 206.826.5775 fax I atiberio@marcusmillichap.com
Represented in Indiana by:
John Sebree
Indianapolis Office I 900 E. 96th Street, Suite 150 I Indianapolis, IN 46240
317.218.5300 phone I 317.218.5310 fax I johns@marcusmillichap.com
Bid Date : To Be Determined By Listing Agents
Terms and Conditions : The fee simple interest in the Covered Bridge Apartments is being offered for sale. A purchaser must place new financing on the asset.
Timing : All offers must indicate the length of the Due Diligence period and the Closing time frame.
Deposit : All offers must specify the amount and type of deposit to be made as well as increases upon the removal of any Due Diligence or Financing contingencies.
Investor Identification : The purchasing entity should include a resume outlining relevant ownership and/or management experience of comparable properties, as well as a statement of financial net worth.
Infill Location near Employment,
Retail and Major Thoroughfares
Stable and Growing Employment
Base within 2 Miles
10 Minutes from Indianapolis International Airport
Management and Rental Upside Opportunity
Improving Multi-Family Fundamentals
Strong Amenity Package
Recent Capital Improvements; Replacement of Roofs and Siding
Existing Tax Exempt Bonds That Can Be Purchased and Re-Structured

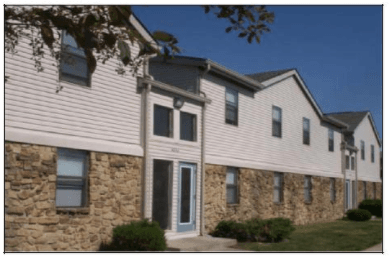
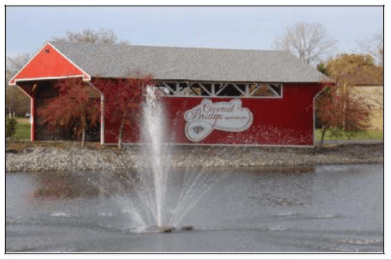
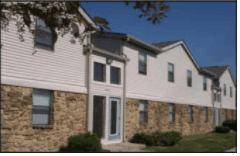
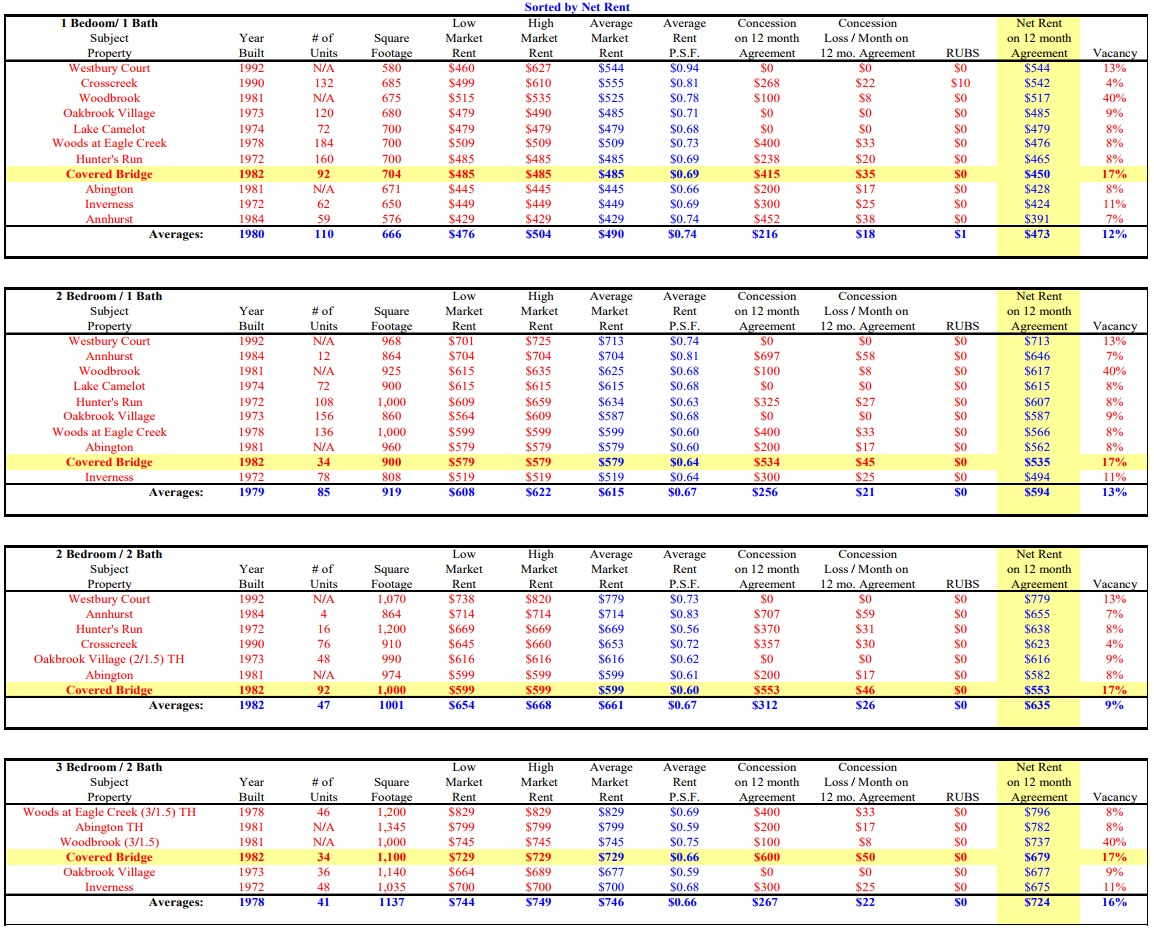
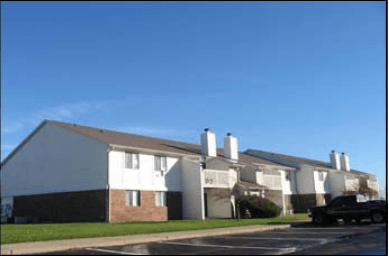
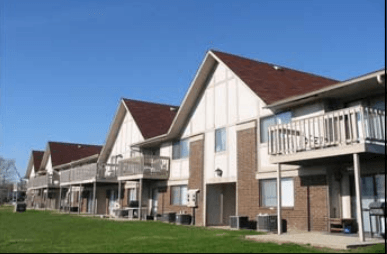
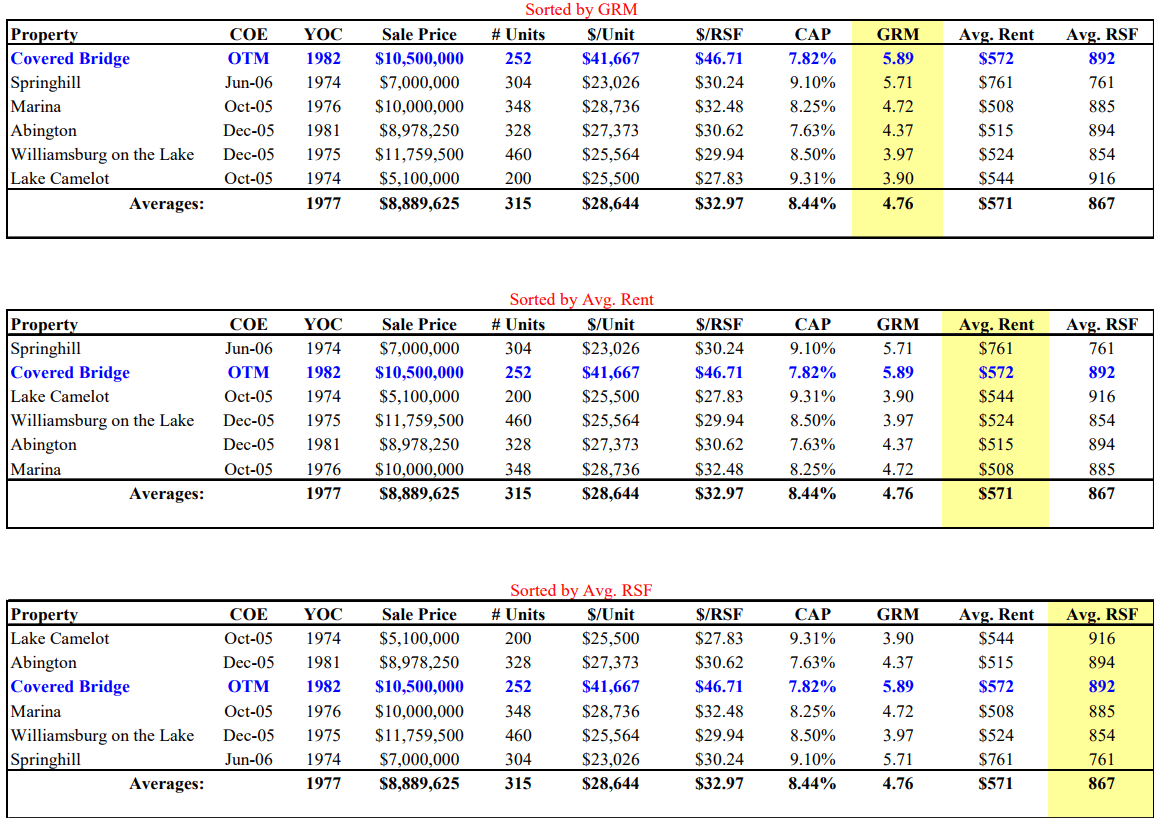
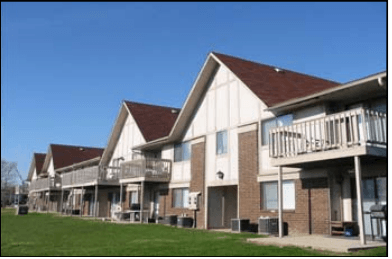
Covered Bridge, a 252-unit apartment community located in Indianapolis, Indiana, presents an excellent opportunity for an investor to acquire an asset with minimal deferred maintenance as the current owner has recently completed nearly $1.0 million in capital improvements, including new roofs and siding on all buildings. A new investor will be able to capitalize on the recent improvements by
improving the on-site management and marketing of the revitalized project as well as increasing the below-market asking rents.
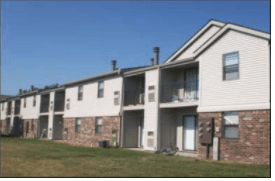
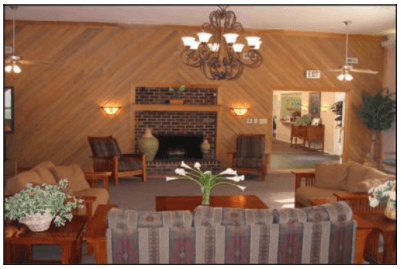
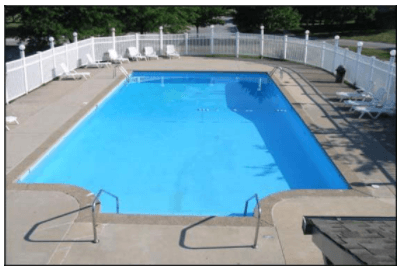
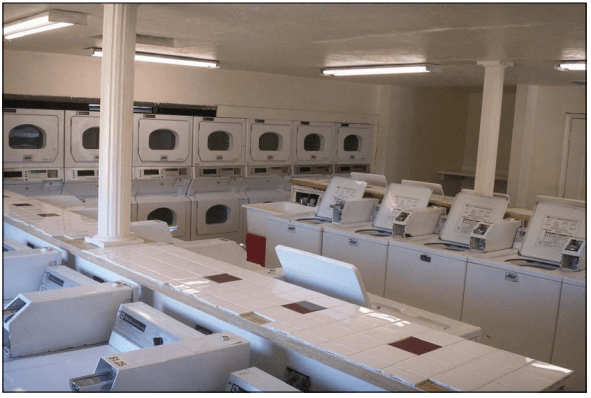
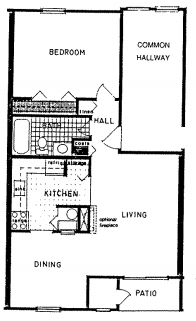
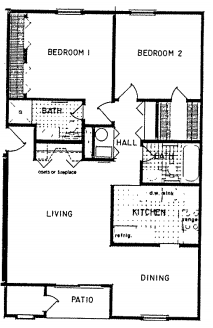
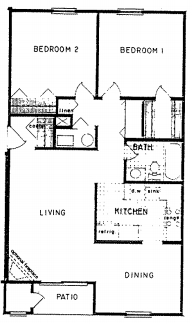
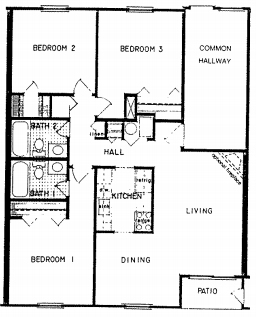
Covered Bridge was originally built in 1982 but has seen many capital improvements since then. Improvements include new gutters, new entrance doors, exterior paint, brick and stone replacement as well as new windows and screens. The property consists of 92 one-bed, one-bath, 34 two-bed, one-bath, 92 two-bed, two-bath and 34 three-bed, two-bath apartment homes. The property offers a strong amenity package with a swimming pool, on-site laundry facility, two-story community room, tennis court and controlled access from covered bridge entrance. The units are well-amenitized with a private balcony or patio, ample storage space, walk-in closets, fireplaces and well-equipped kitchens.
Covered Bridge was acquired in April 1999 and assuming a 501(c) 3 is involved in the purchase of the asset a new owner may obtain acquisition tax credits once the ten-year ownership requirement has been met in 2009. A buyer may place new financing on the asset however the new owner has the option to purchase and restructure the existing tax-exempt bonds.
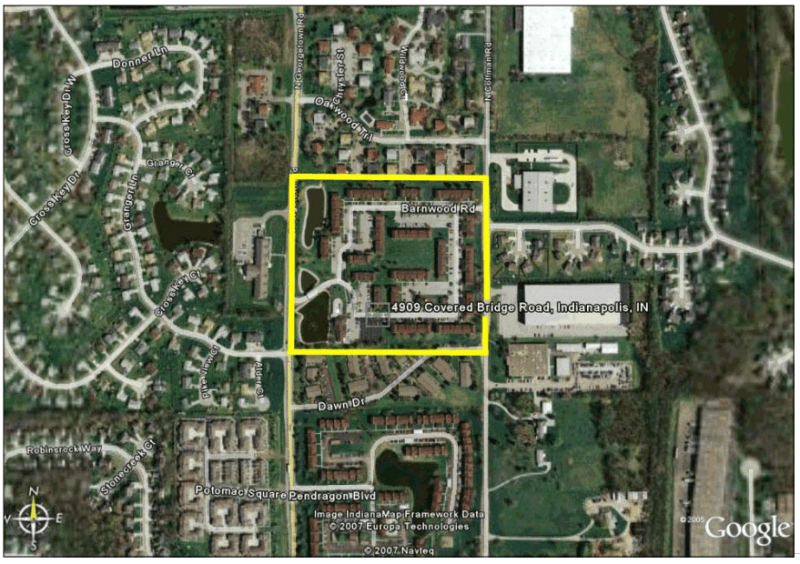
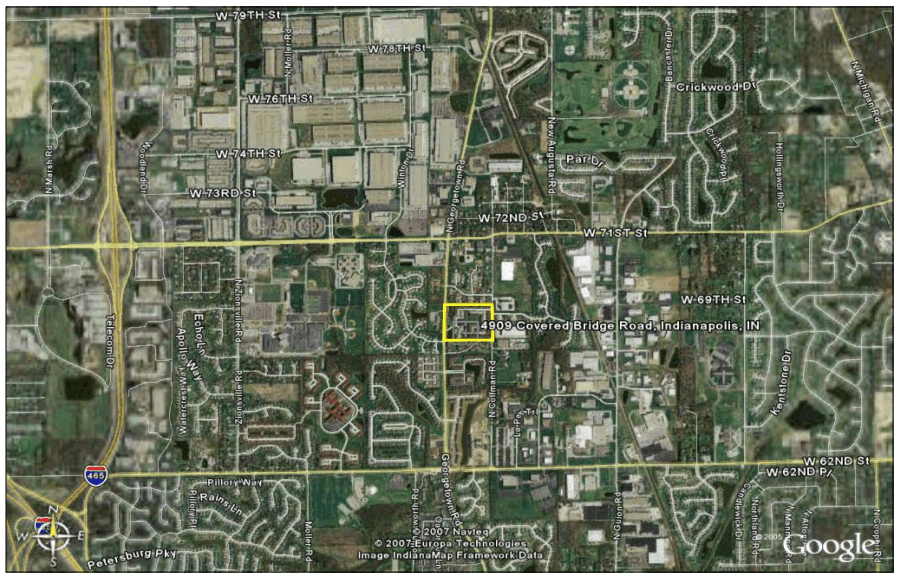
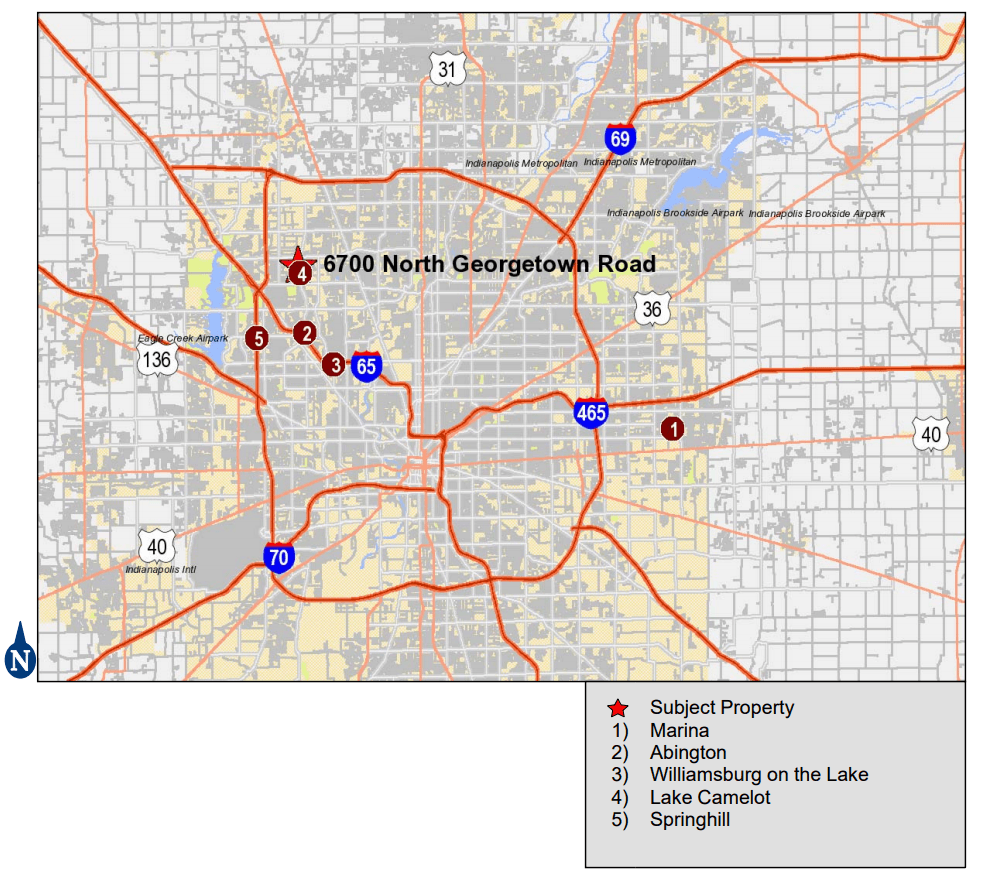
Covered Bridge holds a central location to major employers, retail, restaurants and other neighborhood services. Just one-half mile north of the property is 56th Street, a corridor for retail and restaurant establishments. Lafayette Square Mall, a 1,126,860 GLA Simon Mall located at the corner of Lafayette Road and 38th Street, is just minutes from the property. Residents benefit from being minutes to U.S. 421 and Interstates 465 and 65, allowing access throughout the city of Indianapolis.
Given the expected increase of 14,000 jobs, Indianapolis should witness the largest percentage increase in the past 5 years. There are expected to be 600 new manufacturing jobs from Rolls Royce and 800 new jobs with FedEx. There is also considerable expansion taking place at the Convention Center/Colts Stadium which is expected to generate 4,900 construction jobs and 4,200 permanent jobs. This expansion is expected to bring $2.25 Billion into the local economy over the next 10 years1. Major area employers include Eli Lilly and Company, Clarian Health Partners, Community Health Network, Indiana University, FedEx and Rolls-Royce2.
The area north of Covered Bridge consists of a mix of single- and multi-family housing and industrial/business parks. Park 100, a 13 million square foot office and industrial park, is approximately one mile north of Covered Bridge and Corporate Center North, another industrial business park is located less than two miles northwest. INTECH Park, an 865,000 square foot office park located one mile west of Covered Bridge, is expected to surpass 2.5 million square feet of office space when fully developed.
Average occupancy and rents in the Indianapolis MSA are rising as concessions and new construction continues to fall. The city saw an increase in average occupancy of 1.2 percent over the last year coupled with a 2.3 percent increase in average rent3. Covered Bridge is well positioned in the marketplace to benefit from improving multi-family fundamentals.
THE OFFERING
| Property | Property Covered Bridge |
| Propery Address | 6700 North Georgetown Road INDIANAPOLIS, IN 46268 |
| Assessor's Parcel Number | 6011625 |
| Zoning | D62-Multi-Family |
SITE DESCRIPTION
| Number of Units | 252 |
| Number of Buildings | 20 |
| Number of Stories | 2 and 3 |
| Year Built | 1982 |
| Rentable Square Feet | 224,768 |
| Lot Size | 18.39 Acres |
| Density | 13.7 Units/Acre |
| Parking | 487 Open Spaces |
| Parking Ratio | 1.93 Spaces/Unit |
UTILITIES
| Water | Indianapolis Water |
| Phone | SBC |
| Electric | Indianapolis Power & Light (IPL) |
| Gas | Citizen's Gas |
CONSTRUCTION
| Foundation | Concrete Stab |
| Framing | Wood Frame |
| Exterior | Brick and Vinyl |
| Parking Surface | Asphalt |
| Roof | Pitched Roof W/Wood Truss Framing |
MECHANICAL
| HVAC | Gas Furnace-Closet Mounted |
| Fire Protection | Smoke Detectors; Has 6 Fire Hydrants |
UNIT AMENITIES
• Well-Equipped Kitchens
• Walk-In Closet
• Balcony/Patio
• Fireplace
COMMON AREA AMENITIES
• Swimming Pool & Tennis Courts
• Clubhouse & Courtyard
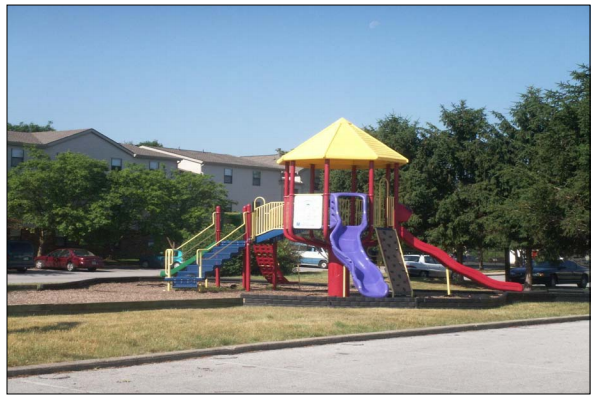
• Children's Playground
• Interior Hallways
• Billiards Tables

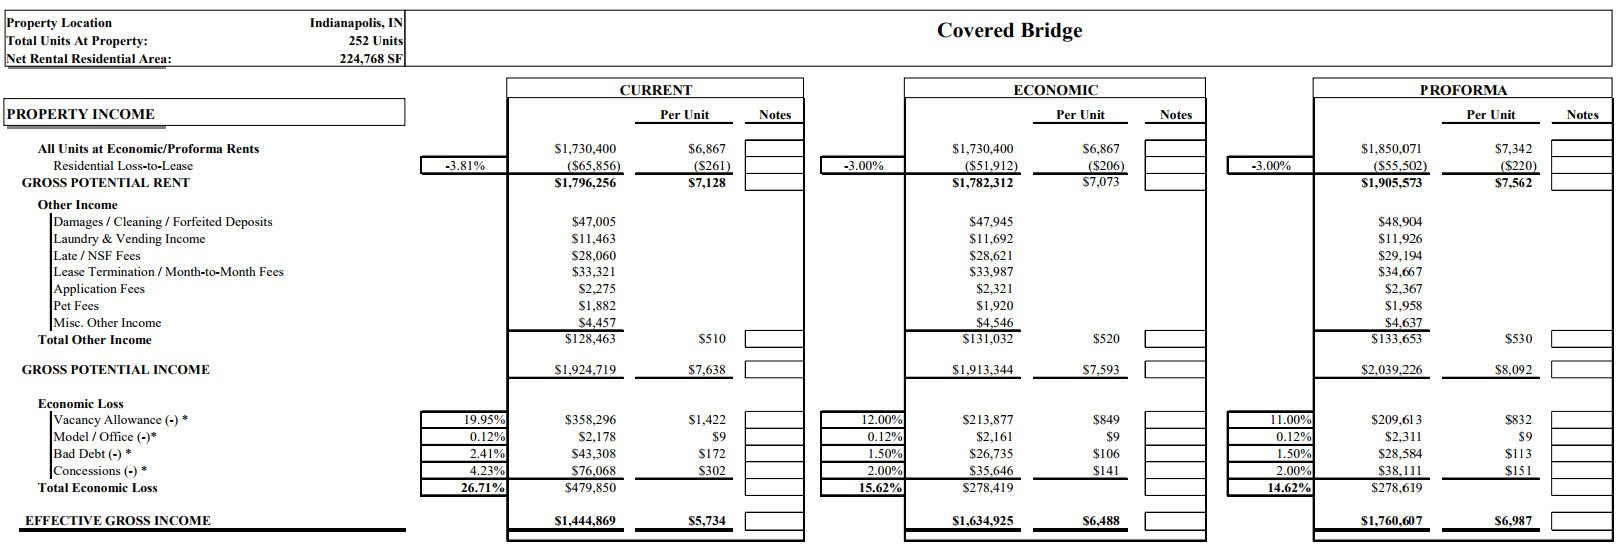
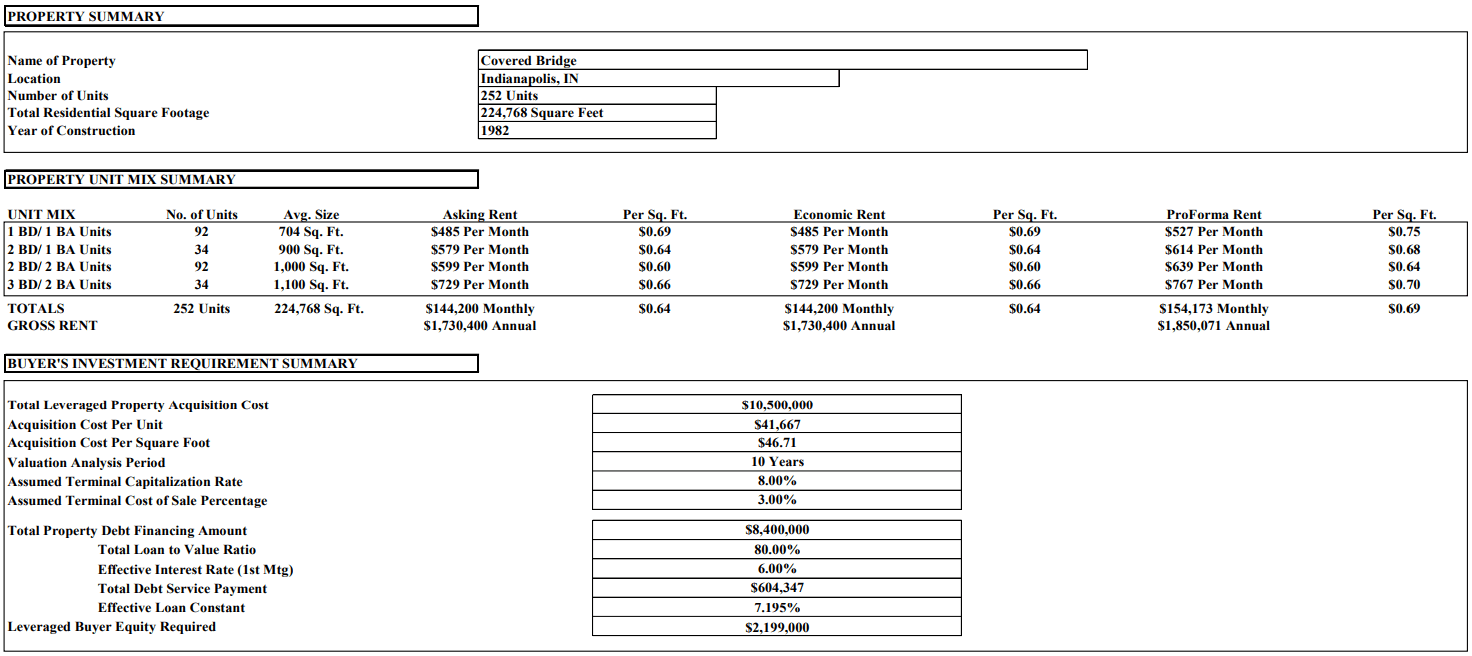
FINANCIAL SUMMARY
PROPERTY DESCRIPTION
| Property | Covered Bridge |
| Property Address | 4909 Covered Bridge Road Indianapolis, IN |
| Number of Units | 252 Units |
| Net Rentable Area | 224,768 SF |
| Year Built | 1982 |
PRICING
| Total Purchase Price | $10,500,000 |
| List Price Per Unit | $41,667 |
| List Price Per SF | $46.71 |
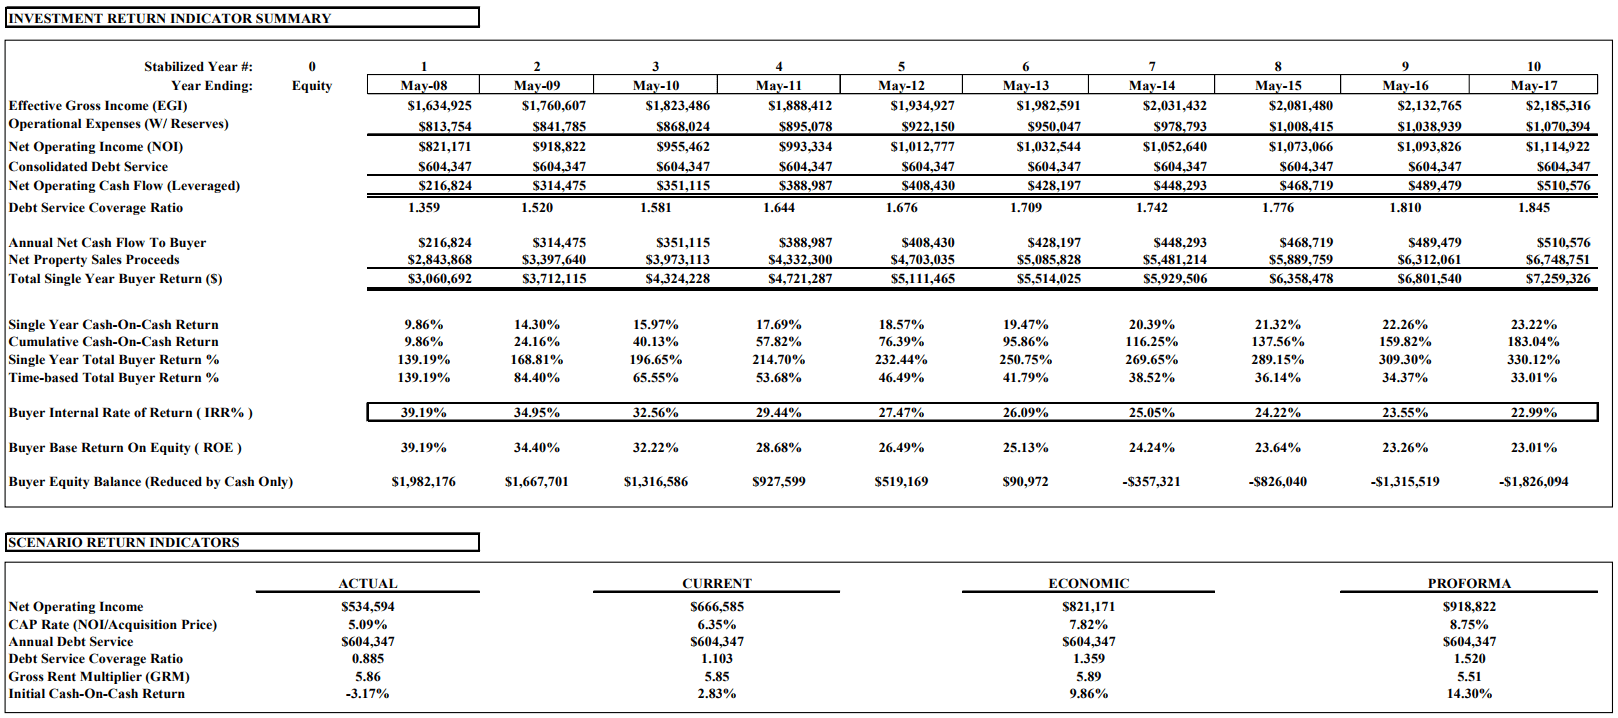
FINANCIAL RETURNS
| Current NOI | $666,585 |
| Current GRM | 5.86 |
| Current CAP Rate | 6.35% |
| Current Cash-on-Cash | 2.83% |
| Economic NOI | $821,171 |
| Economic GRM | 5.89 |
| Economic CAP Rate | 7.82% |
| Economic Cash-on-Cash | 9.86% |
| Proforma NOI | $918,822 |
| Proforma GRM | 5.51 |
| Proforma CAP Rate | 8.75% |
| Proforma Cash-on-Cash | 14.30% |
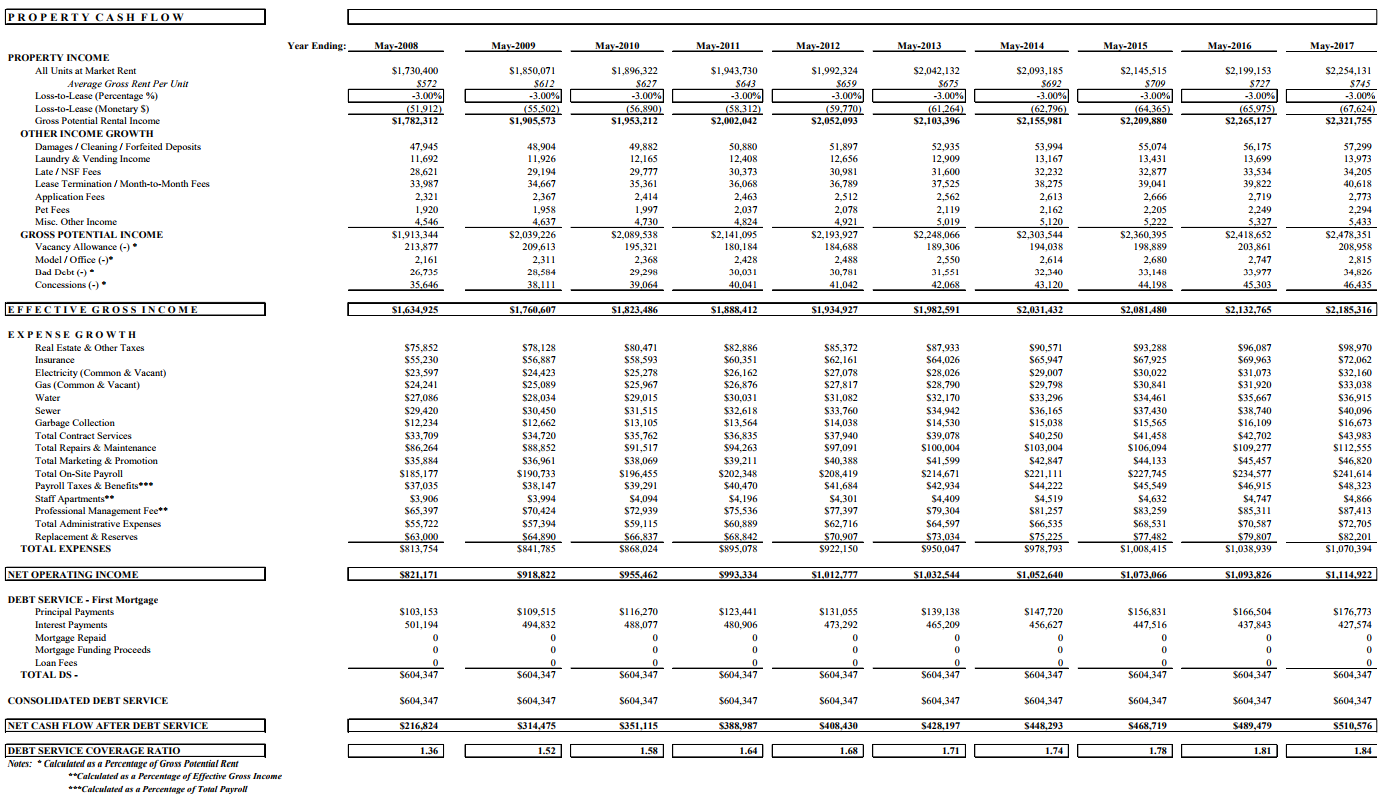
PROJECTED RETURNS - BASED ON 10 YEAR ANALYSIS PERIOD
| 10 Year Leveraged IRR | 22.99% |
DEBT FINANCING*
| Loan Amount | $8,400,000 |
| Loan-to-Value Ratio | 80.00% |
| Current Debt Service Coverage Ratio | 1.10 |
| Economic Debt Service Coverage Ratio | 1.36 |
| Equity Required (Including Closing Costs) | $2,199,000 |
*See Assumptions page for further detail
ASSUMPTIONS
PROPERTY INFORMATION
| Name of Property | Covered Bridge |
| Street Address | 4909 Covered Bridge Road |
| City, State | Indianapolis, IN |
| Zip Code | 46268 |
| Total Number of Units at the Property | 252 Units |
| Total Net Rentable Residential Area | 224,768 SF |
| Property Type | Market Rate - Family |
| Year Project Was Originally Built | 1982 |
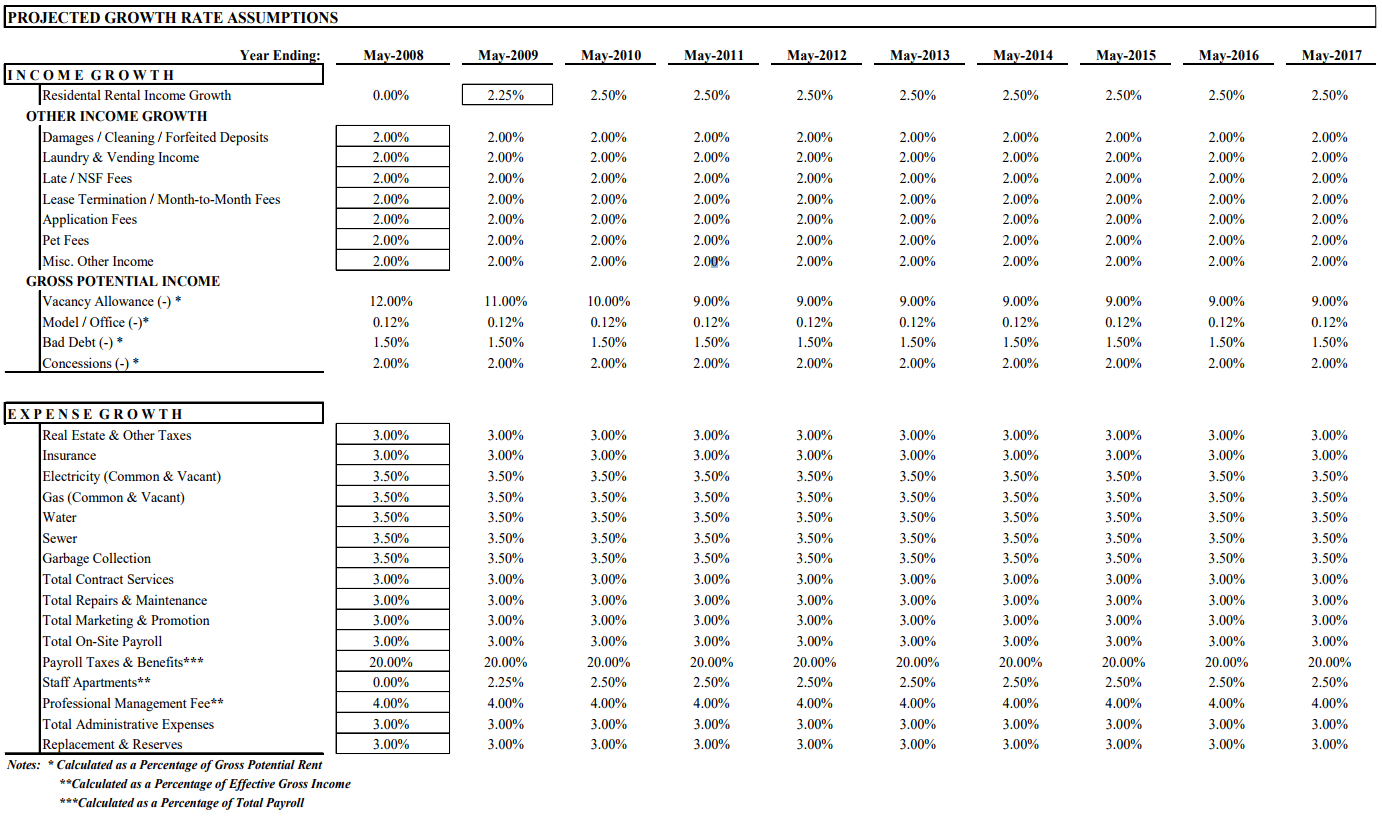
ANALYSIS TIMING
| Date of Current Monthly Property Operations: | January-01-2007 |
| Effective Start Date of This Analysis: | June-01-2007 |
| End of First Year of Analysis: | May-31-2008 |
| End of Analysis (Hold Period): | May-31-2017 |
| Property Valuation Analysis Period (Hold Period) | 10 Years |
DEBT FINANCING
| First Mortgage | |
| Proposed or Existing | Proposed |
| Loan Type | Amortizing |
| Loan Origination Date | June-2007 |
| Original Loan Amount | $8,400,000 |
| Loan Amount as of Start of Analysis | $8,400,000 |
| Loan-to-Sales Price Ratio | 80.00% |
| Interest Rate Methodology (360 or 365) | 360 |
| Permanent Interest Rate | 6.000% |
| Term | 10.00 Years |
| Amortization Period (enter "0" for Interest Only) | 360 Months |
| Loan Constant | 7.195% |
| Annual Debt Service Payment | $604,347 |
| Maturity Date | May-2017 |
| Outstanding Loan Balance at Maturity | $7,029,601 |
| Loan Origination/Assumption Fees | $84,000 |
| Include Loan Fees in Year 1 Cash Flow | NO |
| Include Loan Fees in Acquisition Reserve | YES |
ASSUMPTIONS
| CONSOLIDATED DEBT SUMMARY | Effective At Start of Analysis |
| Total Combined Debt Financing (Start of Analysis) | $8,400,000 |
| Estimated Property Sales Price (From Below) | $10,500,000 |
| Total Loan-to-Sales Price Ratio (LTV) | 80.00% |
| Estimated Acquisition Price (Includes Reserves) | $10,599,000 |
| Total Loan-to-Acquisition Price Ratio (LTV) | 79.25% |
| Effective Loan Constant | 7.195% |
| Consolidated Annual Debt Service Payment | $604,347 |
| Current Debt Service Coverage Ratio | 1.10 |
| Economic Debt Service Coverage Ratio | 1.36 |
PROPERTY ACQUISITION & VALUE ANALYSIS
| Real Estate Price | $10,500,000 |
| Price per Unit | $41,667 Per Unit |
| Price per Square Foot | $46.71 Per Sq. Ft. |
| Acquisition Reserves | |
| Due Diligence & Closing Costs | $15,000 |
| Loan Origination Fee | $84,000 |
| Total Acquisition Reserves | $99,000 |
| Total Leveraged Acquisition Cost | $10,599,000 |
| Equity Required | $2,199,000 |
| Equity-to-Total Leveraged Acquisition Cost Ratio | 20.75% |
| Total Loan Amount | $8,400,000 |
| Loan-to-Total Leveraged Acquisition Cost Ratio | 79.25% |
| Reserves Per Unit | $250 Unit/Yr |
| Terminal CAP Rate (Residual) | |
| Base Case | 8.00% |
| Cost of Sale (Residual) | 3.00% |
NOTES & COMMENTS
Assumes new financing.
This property currently qualifies for a charitable tax exemption which requires non-profit ownership. This analysis
assumes the purchaser will qualify for the same exemption.
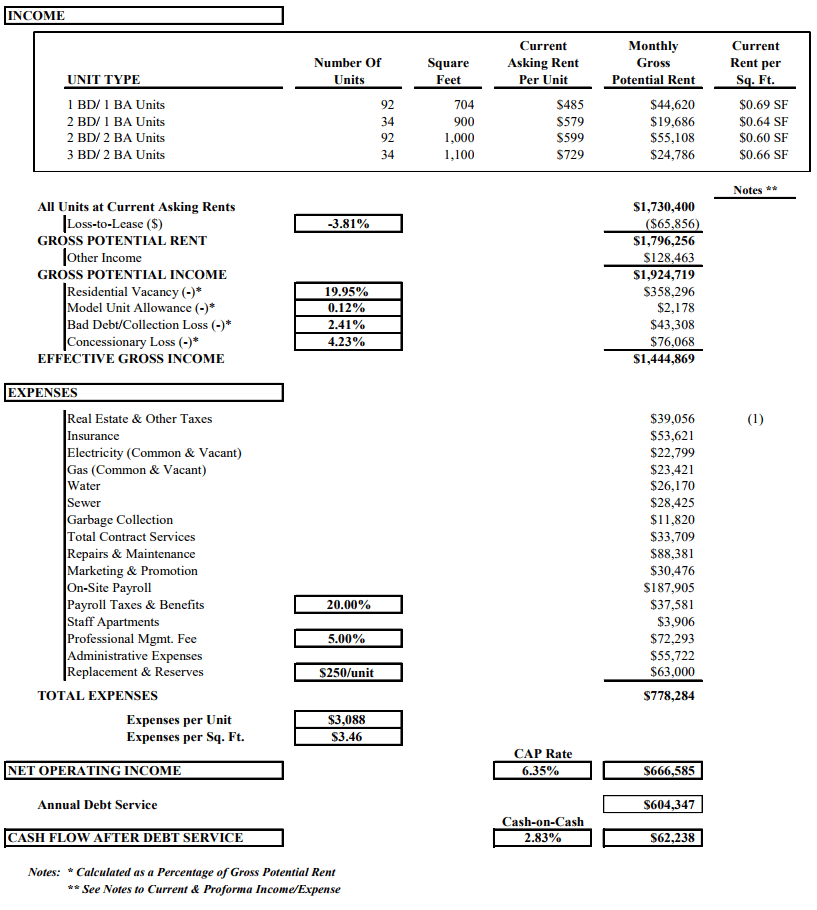
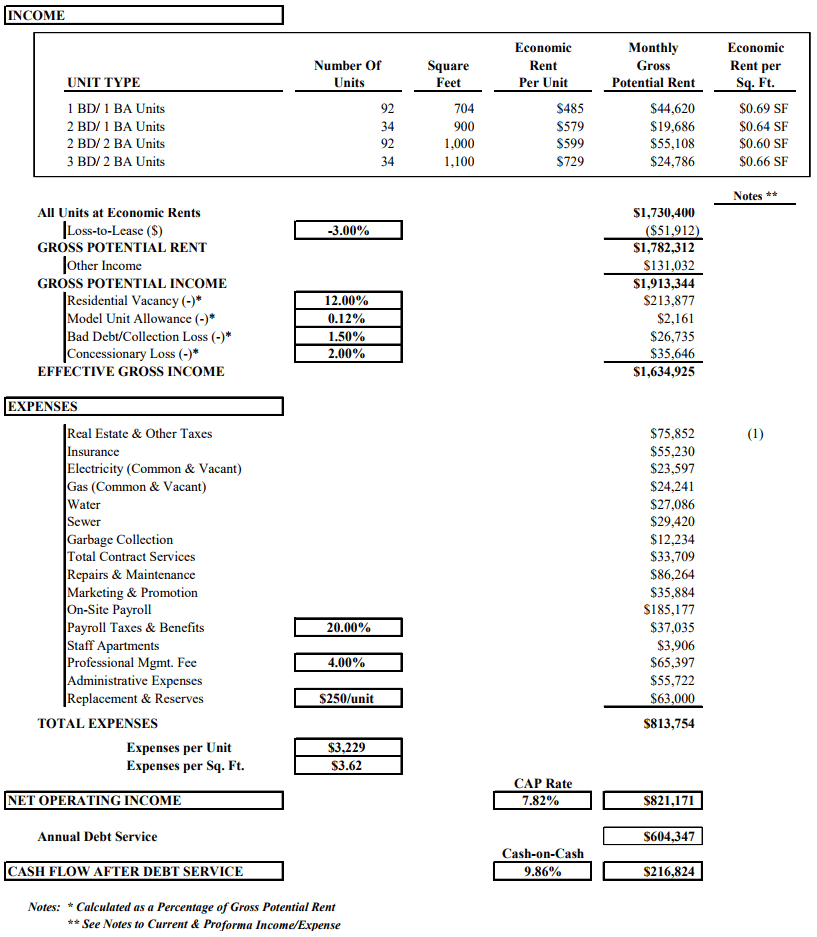
Detailed Unit Mix
ONE BEDROOM / ONE BATH UNIT SUMMARY
| Type | No. | RSF | Asking Rents | Economic Rents | Proforma Market Rents |
| 1 BD/ 1 BA | 92 | 704 | $485 | $485 | $515 |
| 1 BD/ 1 BA | 92 | 64,768 | $44,620 | $44,620 | $47,380 |
| Averages | 704 | $485 | $485 | $515 |
TWO BEDROOM / ONE BATH UNIT SUMMARY
| Type | No. | RSF | Asking Rents | Economic Rents | Proforma Market Rents |
| 2 BD/ 1 BA | 34 | 900 | $579 | $579 | $600 |
| 2 BD/ 1 BA | 34 | 30,600 | $19,686 | $19,686 | $20,400 |
| Averages | 900 | $579 | $579 | $600 |
TWO BEDROOM / TWO BATH UNIT SUMMARY
| Type | No. | RSF | Asking Rents | Economic Rents | Proforma Market Rents |
| 2 BD/ 2 BA | 92 | 1,000 | $599 | $599 | $625 |
| 2 BD/ 2 BA | 92 | 92,000 | $55,108 | $55,108 | $57,500 |
| Averages | 1,000 | $599 | $599 | $625 |
THREE BEDROOM / TWO BATH UNIT SUMMARY
| Type | No. | RSF | Asking Rents | Economic Rents | Proforma Market Rents |
| 3 BD/ 2 BA | 34 | 1,100 | $729 | $729 | $750 |
| 3 BD/ 2 BA | 34 | 37,400 | $24,786 | $24,786 | $25,500 |
| Averages | 1,100 | $729 | $729 | $750 |
SUMMARY OF TOTAL RENTS
| Units | Total RSF | Asking Rents | Economic Rents | Proforma Market Rents | |
| TOTALS | 252 | 224,768 | $144,200 | $144,200 | $150,780 |
UNIT MIX SUMMARY
| Unit Type | No | Unit RSF | Asking Rents | Economic Rents | Proforma Market Rents |
| 1 BD/ 1 BA Units | 92 | 704 | $485 | $485 | $515 |
| 2 BD/ 1 BA Units | 34 | 900 | $579 | $579 | $600 |
| 2 BD/ 2 BA Units | 92 | 1,000 | $599 | $599 | $625 |
| 3 BD/ 2 BA Units | 34 | 1,100 | $729 | $729 | $750 |
| Averages | 252 | 892 | $572 | $572 | $598 |
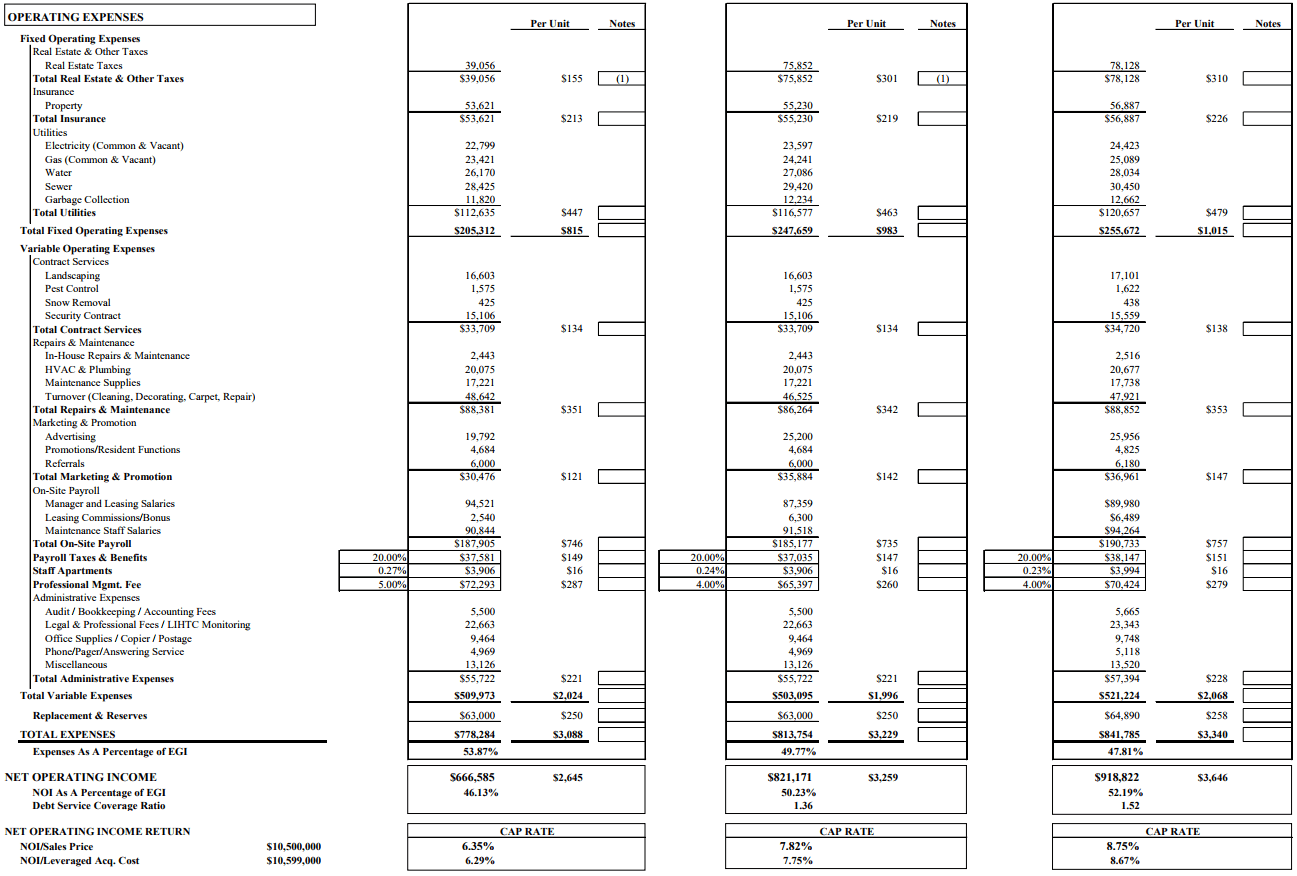
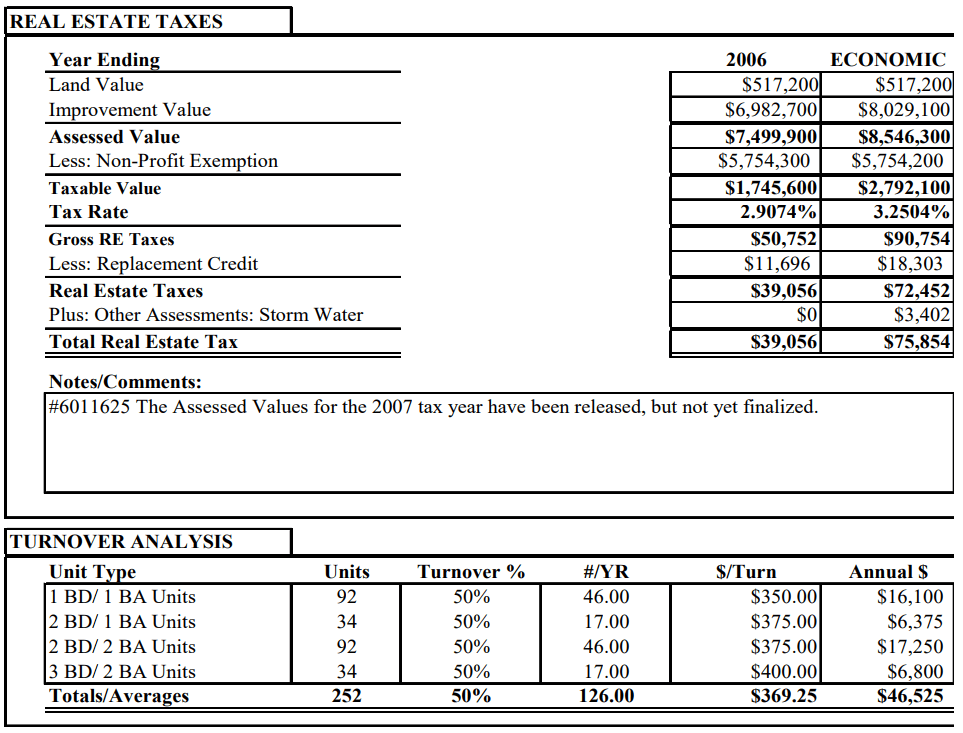
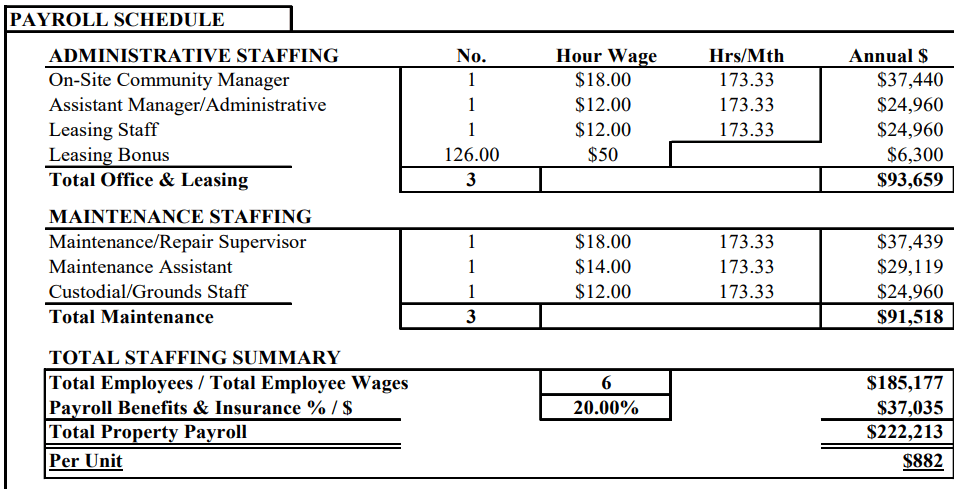
(1) Real Estate Taxes: See Real Estate Tax Analysis on following page.
(1) Real Estate Taxes: The property was last physically assessed in 1999; however, beginning with the 2006 tax year, properties are subject to an annual "trending." This is a form of mass appraisal recently adopted by the state legislature. A sale does not trigger a reassessment to the sales price. Values are reached by applying three separate appraisal methods (the income, cost, and market approaches), then taking the lowest of the three resulting values. This property currently qualifies for a charitable exemption which requires non-profit ownership. This analysis assumes the purchaser will qualify for the same exemption.
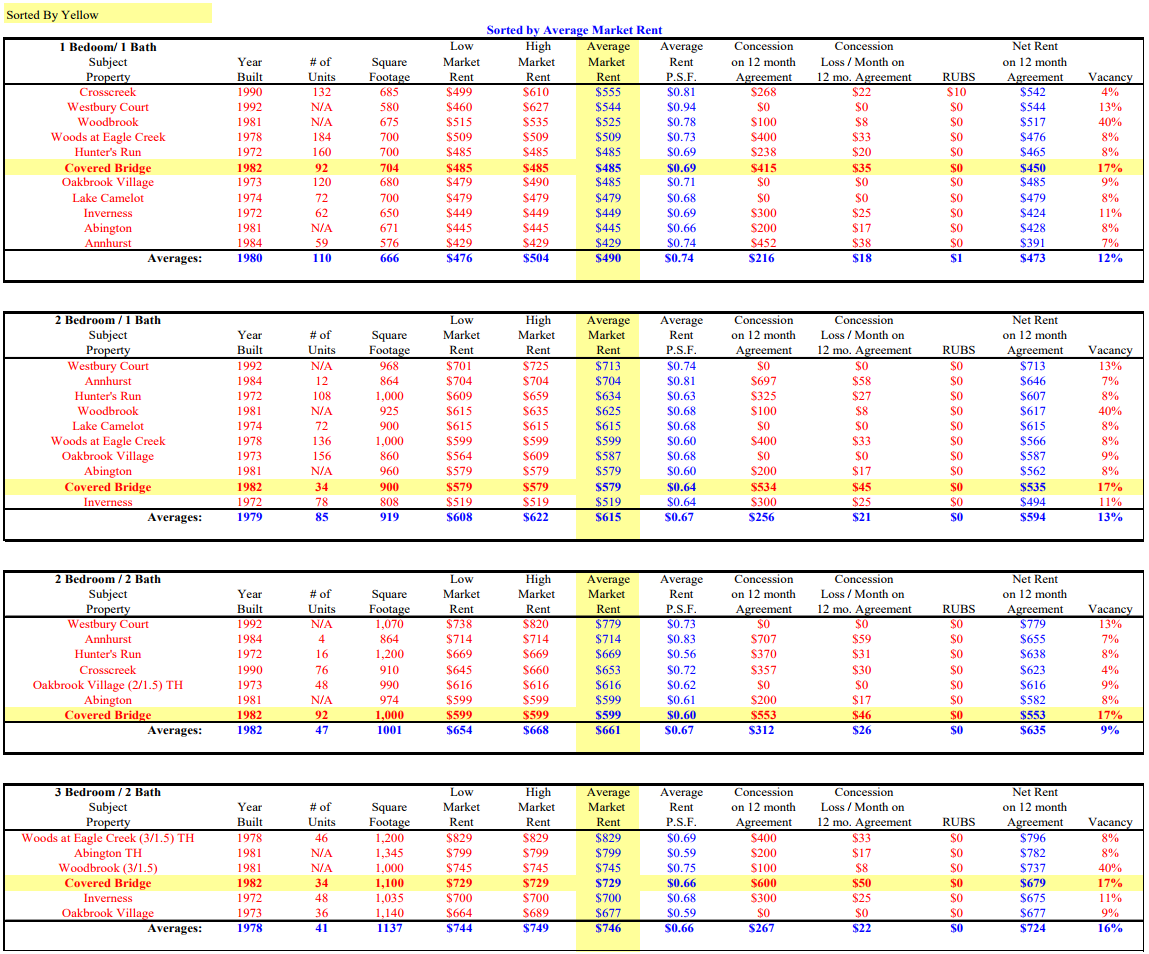
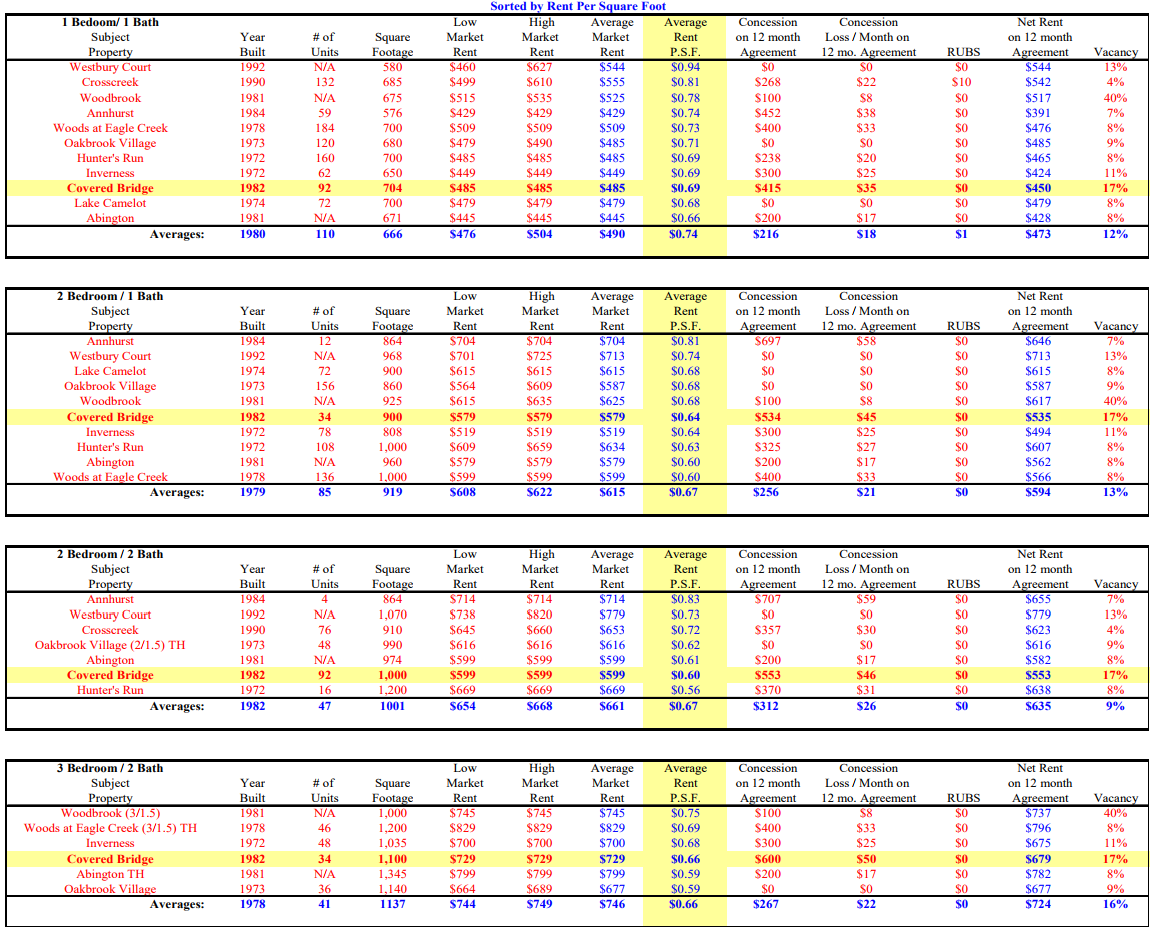
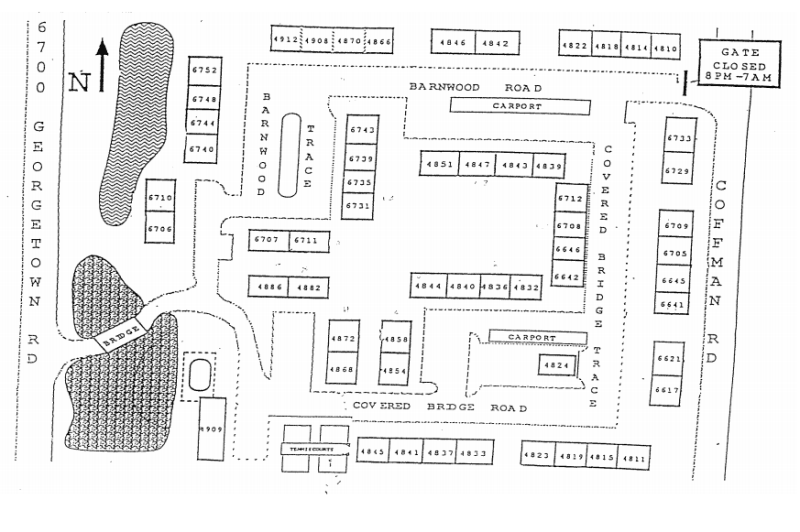
COVERED BRIDGE
6700 North Georgetown Road
INDIANAPOLIS, IN 46268
SUBJECT PROPERTY
| No. of Units | 252 |
| Occupancy: | 82% |
| Year Built: | 1982 |
| Unit Type | No. of Units | SF | Rent | Rent/SF |
| 1 Bdr 1 Bath | 92 | 704 | $485 | $0.69 |
| 2 Bdr 1 Bath | 34 | 900 | $579 | $0.64 |
| 2 Bdr 2 Bath | 92 | 1,000 | $599 | $0.60 |
| 3 Bdr 2 Bath | 34 | 1,100 | $729 | $0.66 |
| Total/Wtd. | 252 | 224,768 | $572 | $0.64 |
COMMENTS
Concessions: One Month Free With a 13-Month Lease; Utilities: Tenant Pays Electricity & Gas, WSG Included.
CROSSCREEK
5756 Crosscreek Drive
Indianapolis, IN 46254
SUBJECT PROPERTY
| No. of Units | 208 |
| Occupancy: | 96% |
| Year Built: | 1990 |
| Unit Type | No. of Units | SF | Rent | Rent/SF |
| 1 Bdr 1 Bath | 132 | 510 - 860 | $499 - $610 | $0.81 |
| 2 Bdr 2 Bath | 76 | 910 | $645 - $660 | $0.72 |
| Total/Wtd. Avg | 208 | $603 | $0.77 |
COMMENTS
Concessions: Half-Month Free With a 13-Month Lease; Utilities: Tenant Pays WS (RUBS) & Electricity, Garbage Included, No Gas
WESTBURY COURT
774 Santa Monica Drive
Indianapolis, IN 46268
| No. of Units | 484 |
| Occupancy: | 87% |
| Year Built: | 1992 |
Unit Type | No. of Units | SF | Rent | Rent/SF |
| 1 Bdr 1 Bath | N/A | 516 - 644 | $460 - $627 | $0.94 |
| 2 Bdr 1 Bath | N/A | 968 | $701 - $725 | $0.74 |
| 2 Bdr 2 Bath | N/A | 1,070 | $738 - $820 | $0.73 |
| 2 Bdr 2.5 Bath Twnhs | N/A | 1,165 | $819 | $0.70 |
| 3 Bdr 2.5 Bath Twnhs | N/A | 1,226 - 1,257 | $839 - $887 | $0.70 |
| Total/Wtd. Avg. | $743 | $0.76 |
COMMENTS
No Concessions; Utilities: Tenant Pays Electricity, WSG Included, No Gas
WOODBROOK
5302 Woodbrook Drive
Indianapolis, IN 46254
| No. of Units | 196 |
| Occupancy: | 60% |
| Year Built: | 1981 |
| Unit Type | No. of Units | SF | Rent | Rent/SF |
| 1 Bdr 1 Bath | N/A | 675 | $515 - $535 | $0.78 |
| 2 Bdr 1 Bath | N/A | 615 | $615 - $635 | $1.02 |
| 2 Bdr 1.5 Bath | N/A | 950 | $625 - $645 | $0.67 |
| 3 Bdr 1.5 Bath | N/A | 1,000 | $745 | $0.75 |
| Total/Wtd. Avg. | $632 | $0.81 |
COMMENTS
Concessions: $100 Off 1BD & 2BD Floorplans With a 12-Month Lease; Utilities: Tenant Pays WSG (Metered) & Electricity, No Gas.
WOODS AT EAGLE CREEK
4949 Bobwhite Lane
Indianapolis, IN 46254
| No. of Units | 460 |
| Occupancy: | 92% |
| Year Built: | 1978 |
| Unit Type | No. of Units | SF | Rent | Rent/SF |
| 1 Bdr 1 Bath | 184 | 700 | $509 | $0.73 |
| 2 Bdr 1 Bath | 136 | 900 | $599 | $0.67 |
| 2 Bdr 1.5 Bath Twnhs | 94 | 1,000 | $699 | $0.70 |
| 3 Bdr 1.5 Bath Twnhs | 46 | 1,200 | $829 | $0.69 |
| Total/Wtd. Avg | 460 | $659 | $0.70 |
COMMENTS
Concessions: $400 Off First Month's Rent if Moved in 2-Weeks After Application Date; Utilities: Tenant Pays Electricity, WSG
Included, No Gas.
HUNTER'S RUN
52nd and Georgetown
Indianpolis, IN 46254
| No. of Units | 304 |
| Occupancy: | 92% |
| Year Built: | 1972 |
| Unit Type | No. of Units | SF | Rent | Rent/SF |
| Studio | 20 | 550 | $419 | $0.76 |
| 1 Bdr 1 Bath | 160 | 700 | $485 | $0.69 |
| 2 Bdr 1 Bath | 108 | 900 - 1,100 | $609 - $659 | $0.63 |
| 2 Bdr 2 Bath | 16 | 1,200 | $669 | $0.56 |
| Total/Wtd. Avg. | 304 | $551 | $0.66 |
COMMENTS
Concessions: Half-Month Free With a 12-Month Lease; Utilities: Tenant Pays Electricity & Gas, WSG Included.
OAKBROOK VILLAGE
6098 Georgetown Road
Indianapolis, IN 46254
| No. of Units | 384 |
| Occupancy: | 91% |
| Year Built: | 1973 |
| Unit Type | No. of Units | SF | Rent | Rent/SF |
| 1 Bdr 1 Bath | 120 | 680 | $479 - $490 | $0.71 |
| 2 Bdr 1 Bath | 156 | 860 | $564 - $609 | $0.68 |
| 2 Bdr 1.5 Bath Twnhs | 48 | 990 | $616 | $0.62 |
| 3 Bdr 1.5 Bath Twnhs | 24 | 1,204 | $778 | $0.65 |
| 3 Bdr 2 Bath | 36 | 1,140 | $664 - $689 | $0.59 |
| Total/Wtd. Avg. | 384 | $628 | $0.65 |
COMMENTS
No Concessions; Utilities: Tenant Pays Electricity & Gas, WSG Included.
LAKE CAMELOT
6475 Excalibur Court
Indianapolis, IN 46268
| No. of Units | 200 |
| Occupancy: | 92% |
| Year Built: | 1974 |
| Unit Type | No. of Units | SF | Rent | Rent/SF |
| 1 Bdr 1 Bath | 72 | 700 | $479 | $0.68 |
| 2 Bdr 1 Bath | 72 | 900 | $615 | $0.68 |
| 2 Bdr 1.5 Bath Twnhs | 28 | 1,100 | $650 | $0.59 |
| 3 Bdr 1 Bath Twnhs | 28 | 1,330 | $785 | $0.59 |
| Total/Wtd. Avg. | 200 | $632 | $0.64 |
COMMENTS
No Concessions; Utilities: WSG & Electricity Included, No Gas.
INVERNESS
5800 Georgetown Road
Indianapolis, IN 46254
| No. of Units | 220 |
| Occupancy: | 89% |
| Year Built: | 1972 |
| Unit Type | No. of Units | SF | Rent | Rent/SF |
| 1 Bdr 1 Bath | 62 | 650 | $449 | $0.69 |
| 2 Bdr 1 Bath | 78 | 808 | $519 | $0.64 |
| 2 Bdr 1.5 Bath Twnhs | 32 | 928 | $600 | $0.65 |
| 3 Bdr 2 Bath | 48 | 1,035 | $700 | $0.68 |
| Total/Wtd. Avg | 220 | $567 | $0.67 |
COMMENTS
Concessions: $300 Off First Month's Rent With a 12-Month Lease; Utilities: Tenant Pays Electricity & Gas, WSG Included.

ABINGTON
4565 Edwardian Court
Indianapolis, IN 46254
| No. of Units | 328 |
| Occupancy: | 92% |
| Year Built: | 1981 |
| Unit Type | No. of Units | SF | Rent | Rent/SF |
| 1 Bdr 1 Bath | N/A | 671 | $445 | $0.66 |
| 2 Bdr 1 Bath | N/A | 960 | $579 | $0.60 |
| 2 Bdr 1.5 Bath Twnhs | N/A | 1,170 | $699 | $0.60 |
| 2 Bdr 2 Bath | N/A | 974 | $599 | $0.61 |
| 3 Bdr 2.5 Bath Twnhs | N/A | 1,345 | $799 | $0.59 |
| Total/Wtd. Avg. | $624 | $0.61 |
COMMENTS
Concessions: $200 Off First Month's Rent With a 12-Month Lease; Utilities: Tenant Pays WSG (Metered), Electricity & Gas.
ANNHURST
67th and Georgetown
Indianapolis, IN 46268
| No. of Units | 83 |
| Occupancy: | 93% |
| Year Built: | 1984 |
| Unit Type | No. of Units | SF | Rent | Rent/SF |
| Studio | 8 | 288 | $411 | $1.43 |
| 1 Bdr 1 Bath | 59 | 576 | $429 | $0.74 |
| 2 Bdr 1 Bath | 12 | 864 | $704 | $0.81 |
| 2 Bdr 2 Bath | 4 | 864 | $714 | $0.83 |
| Total/Wtd. Avg. | 83 | $564 | $0.95 |
COMMENTS
No Concessions; Utilities: Tenant Pays WSG (Metered), Electricity & Gas.

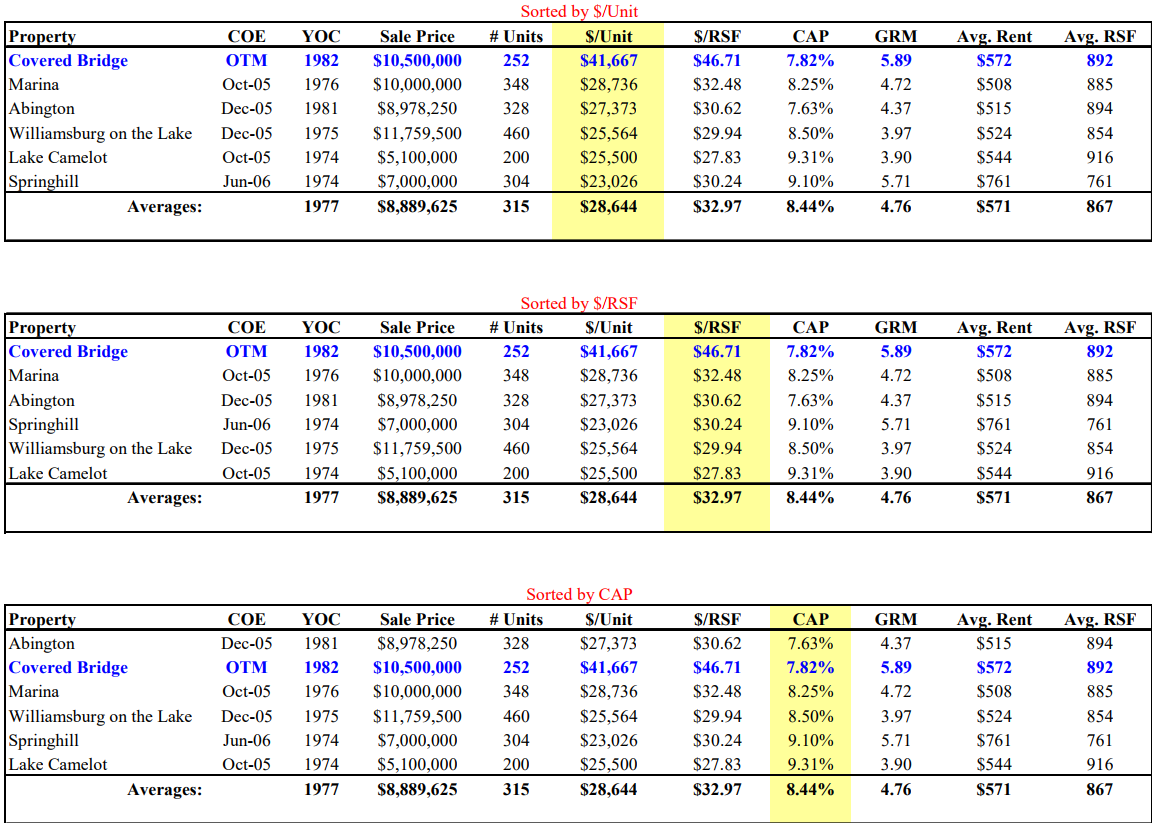
COVERED BRIDGE
6700 North Georgetown Road
INDIANAPOLIS, IN 46268
| No. of Units: | 252 | No. of Units | Unit Type |
| Year Built | 1982 | 92 | 1 Bdr 1 Bath |
| Sales Price | $10,500,000 | 34 | 2 Bdr 1 Bath |
| Price/Unit | $41,667 | 92 | 2 Bdr 1 Bath |
| Price/SF | $46.71 | 34 | 3 Bdr 2 Bath |
| CAP Rate: | 7.82% | ||
| GRM: | 5.89 |
COMMENTS
Average Rent: $572; Vacancy: 12%
MARINA
955 Shoreland Lane
Indianpolis, IN 46229
| No. of Units: | 348 | No. of Units | Unit Type |
| Year Built: | 1976 | 64 | 1 Bdr 1 Bath |
| Sale Price: | $10,000,000 | 80 | 1 Bdr 1 Bath |
| Price/Unit: | $28,736 | 40 | 2 Bdr 1.5 Bath |
| Price/SF: | $32.48 | 100 | 2 Bdr 2 Bath |
| CAP Rate: | 8.25% | 64 | 3 Bdr 1.5 Bath |
| GRM: | 4.72 |
Close of Escrow October 1 2005
COMMENTS
Average Rent: $508; Vacancy: 8%

ABINGTON
4645 Edwardian Court
Indianapolis, IN 46254
| No. of Units: | 328 | No. of Units | Unit Type |
| Year Built: | 1981 | 156 | 1 Bdr 1 Bath |
| Sale Price: | $8,978,250 | 56 | 2 Bdr 1 Bath |
| Price/Unit: | $27,373 | 52 | 2 Bdr 1.5 Bath |
| Price/SF: | $30.62 | 32 | 2 Bdr 2 Bath |
| CAP Rate: | 7.63% | 32 | 3 Bdr 1.5 Bath |
| GRM: | 4.37 |
Close Of Escrow December 1, 2005
COMMENTS
Average Rent: $515; Vacancy: 10%
WILLIAMSBURG ON THE LAKE
3451 Sherburne Lane
Indianapolis, IN 46222
| No. of Units: | 460 | No. of Units | Unit Type |
| Year Built: | 1975 | 196 | 1 Bdr 1 Bath |
| Sale Price: | $11,759,000 | 140 | 2 Bdr 1 Bath |
| Price/Unit: | $25,563 | 96 | 2 Bdr 1.5 Bath |
| Price/SF: | $29.94 | 28 | 3 Bdr 1.5 Bath |
| CAP Rate: | 8.50% | ||
| GRM: | 3.97 |
Close of Escrow December 1, 2005
COMMENTS
Average Rent: $524; Vacancy: 5%
LAKE CAMELOT
6475 Excalibur Court
Indianapolis, IN 46268
| No. of Units: | 200 | No. of Units | Unit Type |
| Year Built: | 1974 | 72 | 1 Bdr 1 Bath |
| Sale Price: | $5,100,000 | 72 | 2 Bdr 1 Bath |
| Price/Unit: | $25,500 | 28 | 2 Bdr 1.5 Bath |
| Price/SF: | $27.83 | 28 | 3 Bdr 1.5 Bath |
| CAP Rate: | 9.31% | ||
| GRM: | 3.90 |
Close of Escrow October 1, 2005
COMMENTS
Average Rent: $544; Vacancy: 7%
SPRINGHILL
6495 Piping Rock Lane
Indianapolis, IN 46254
| No. of Units: | 304 | No. of Units | Unit Type |
| Year Built: | 1974 | 144 | 1 Bdr 1 Bath |
| Sale Price: | $7,000,000 | 80 | 2 Bdr 1 Bath |
| Price/Unit: | $23,026 | 80 | 2 Bdr 2 Bath |
| Price/SF: | $30.24 | ||
| CAP Rate: | 9.10% | ||
| GRM: | 5.71 |
Close of Escrow June 1, 2006
COMMENTS
Average Rent: $761; Vacancy: 12%
MARKET HIGHLIGHTS
Premier distribution hub
Major health sciences center
Low costs of living and doing business
High median household income
GEOGRAPHY
Indianapolis is located in the gently rolling hills of central Indiana. The metro area lacks formidable development barriers, except the several rivers and creeks that traverse the region and the hilly terrain in
Morgan County, southwest of the city. Marion County, home to Indianapolis, is surrounded by mainly rural counties offering builders ample land for residential and commercial development. Growth is primarily concentrated in the northern suburbs.


While some Midwestern MSAs are dealing with declining populations, Indianapolis is adding residents. Indianapolis is the third largest city in the
Midwest after Chicago and Detroit. The metro area is comprised of nine counties, with Marion as the largest.
The largest city in the metro is Indianapolis, claiming over 45 percent of the metro's population. Suburban growth is highest in Hamilton and Hendricks counties.
Indianapolis civic leaders tout the region as a preeminent trade and transportation center, with 50 percent of the U.S. population within an eight-hour drive of the city. The metro area is often referred to as the Crossroads of America due to the four interstates and five railroad lines that converge in Indianapolis. The Indianapolis International Airport is conveniently located close to major business centers, including downtown, which is only nine miles away.
Expansions at the airport during the past two decades have ensured its success in meeting the needs of residents and businesses. Major airlines, including Southwest, ATA and Delta, have recently expanded services, and FedEx maintains one of its primary cargo hubs at the
facility. Airport activity continues to increase and
currently supports 8.5 million passengers per year.
Indianapolis has undergone an economic renaissance during the past two decades. The importance of manufacturing companies has lessened as other employment sectors began to play larger roles in the economy. The metro area has historically been buffered from economic downturns by the presence of the state capital and a multitude of health care firms.
Local pharmaceutical production facilities have helped stabilize manufacturing employment. The metro area is one of the key health sciences centers in the nation, anchored by several pharmaceutical and life sciences
companies. The trade and transportation sector has posted phenomenal growth. During the past three decades, the industry has added over 95,000 positions. This sector claims 22 percent of all jobs in the metro. Indianapolis is easily accessible to many major metro areas by ground or air. Indianapolis outperformed the U.S. economy during the 1990s but is expected to closely track the nation over the coming years. The concentration of intellectually intensive firms, as well as low business costs, will allow the city’s economic revival to continue

Largest Counties: Population Change
| 2005 | 2010 | Change | |
| Marion | 865,500 | 870,500 | 0.6% |
| Hamilton | 244,500 | 303,600 | 24.2% |
| Johnson | 128,700 | 141,400 | 9.9% |
| Hendricks | 128,000 | 150,500 | 17.6% |
One international airport
Four smaller airports
Four interstate freeways
Five railroads
Indianapolis is:


